QoS: Intro to Quality of Service Overview tab
Last updated on February 14, 2022
In the Quality of Service (QoS) report, the first page you see is the Overview tab. This page enables you to monitor the health of your company’s Phone and Video system. Widgets display near real-time information about multiple underlying causes that can contribute to a change in quality. Robust filtering options are available to focus your monitoring and investigations. The report can show either Phone or Video data, which can be accessed by using the toggle in the upper right corner.
Overview dashboard components
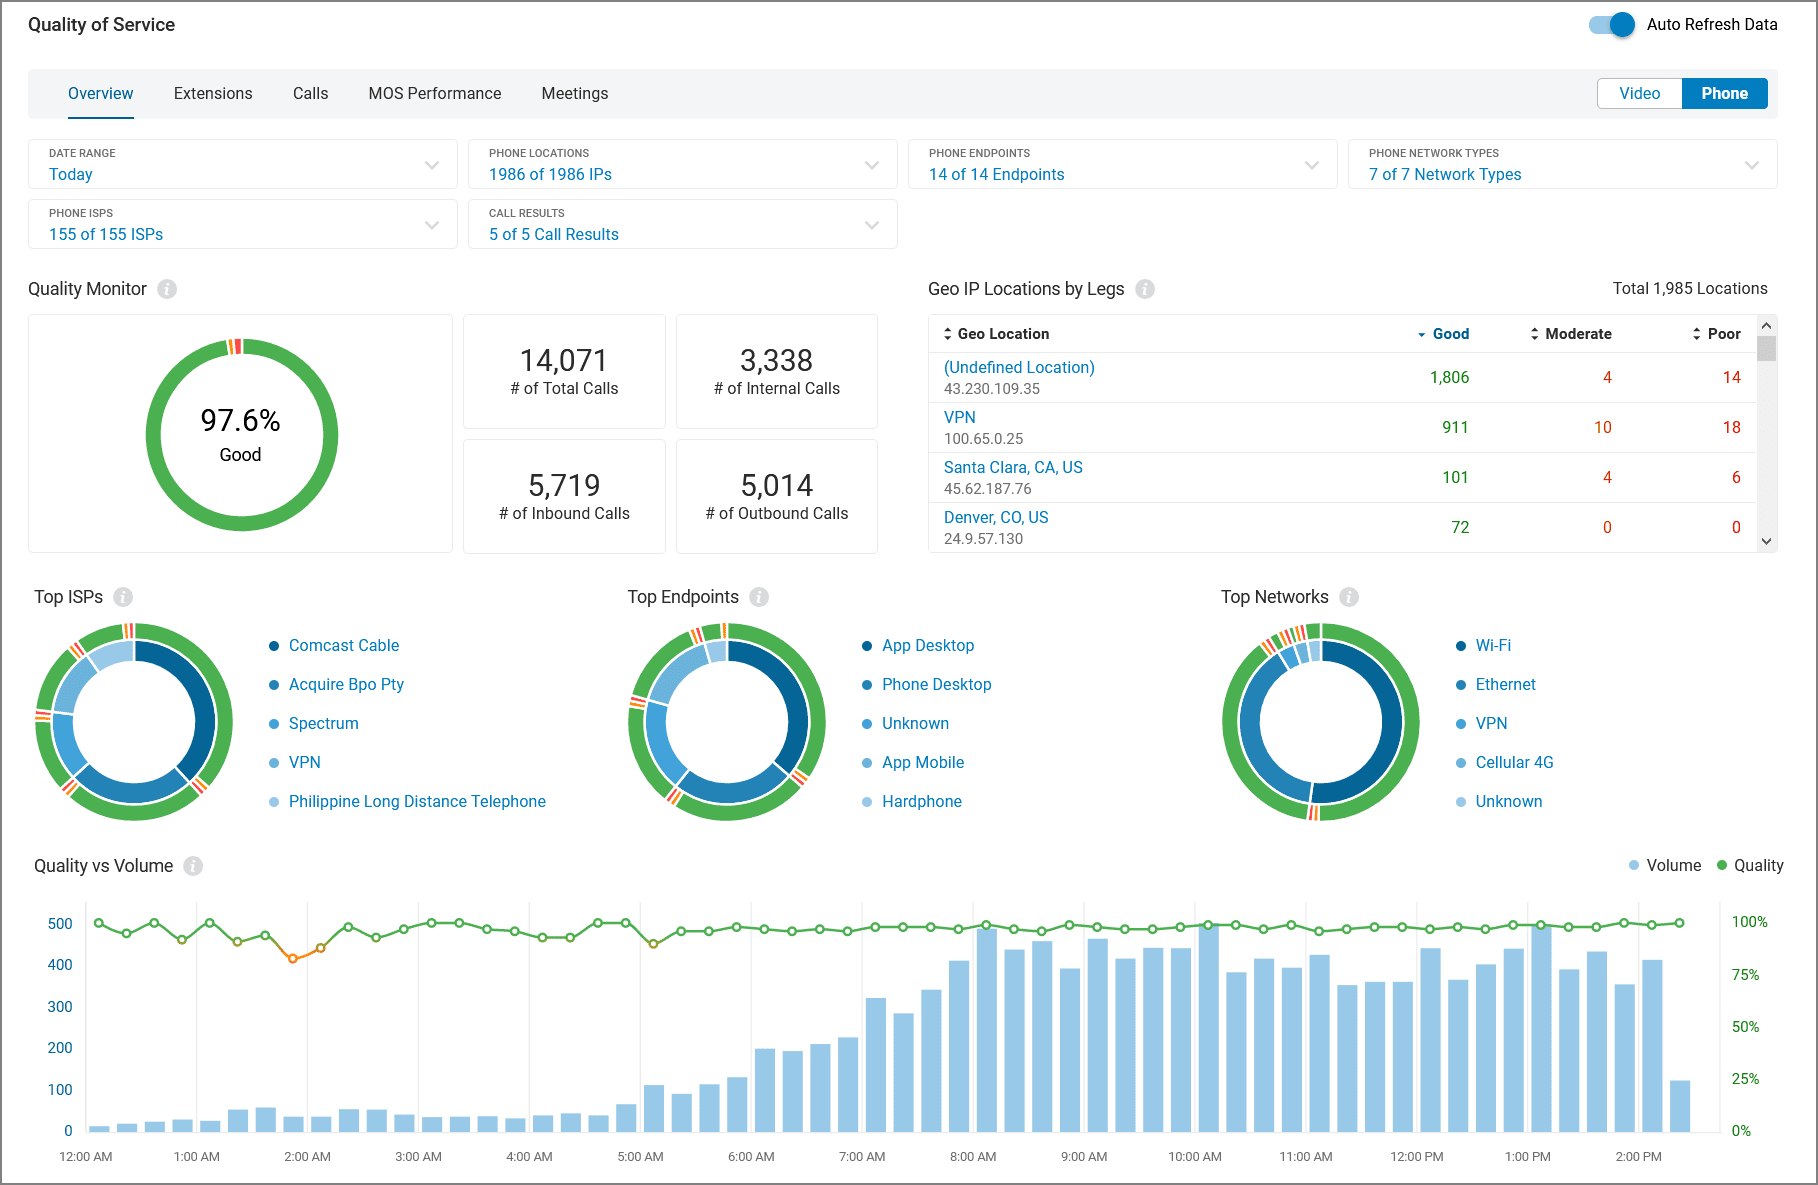
The Quality of Service page is identified in the top left corner. On the far right corner is an Auto Refresh Data slider that lets you freeze the data stream or allow it to continuously refresh.
On the far right of the navigation bar is a toggle that lets you choose between seeing data for Video and Phone in the Overview report.
In the top navigation bar are the tabs available under Quality of Service. Choose any of the other tabs when you want to exit the Overview and review data offered on these other pages.

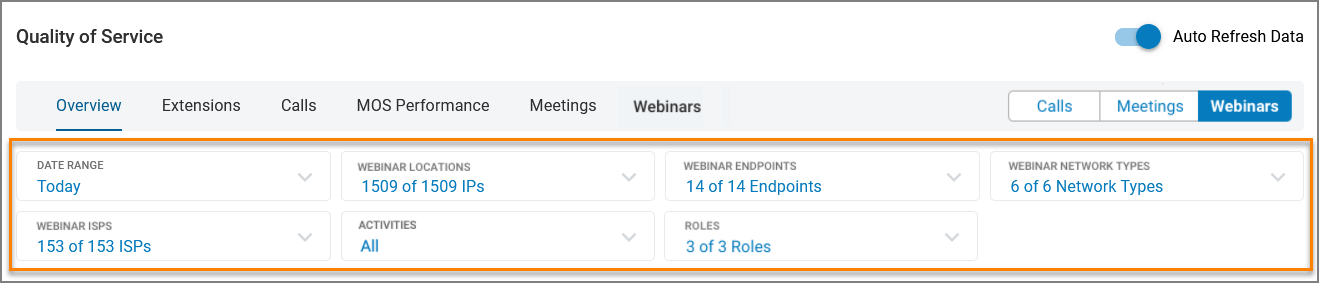
Filters
The Filters section is located beneath the top navigation bar. It allows you to customize your report to only include specific data. Use the dropdown menus in each to select for:
- Date Range: select either a preset range or choose a range going back as far as six months.
- Locations: use checkboxes to select any number of locations to be included in the report.
- Endpoints: checkboxes let you choose one or more endpoints to be included in the report.
- Network Types: checkboxes let you choose one or more network types to be included in the report.
- ISPs: use checkboxes to select any number of ISPs to be included in the report.
- Video Activities or Call Results: depending on the Video/Phone toggle, you will see either details for your choice of video activities used in meetings or results of call activity options.
For multi-site enabled accounts only:
- Site: use checkboxes to select any number of Sites data to be included in the report. Note: for multi-site enabled accounts only.
Widgets
Interactive widgets let you view QoS data for a category of calls and add filters to the Overview page. Hover over any segment for more detailed information.
- Quality Monitor: account level quality across all calls or stream quality across all meetings.
- Geo IP Location: list of geo locations by call volume and number of good, moderate, and poor quality calls or streams per location.
- Top ISPs: Call volume and quality per top ISPs as a percentage of total number of calls or share and quality breakdown of streams by top ISPs.
- Top Endpoints: Call volume and quality per top Vodafone Business UC applications as a percentage of total number of calls or share and quality breakdown of streams by top Vodafone Business UC applications.
- Top Networks: Call volume and quality per top networks as a percentage of total number of calls or volume and quality breakdown of streams by top network types.
- Quality vs Volume: Volume of calls or streams over time and corresponding quality as a percentage of their total number.